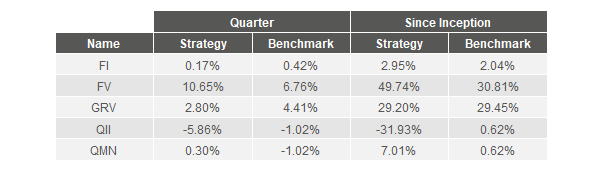
Averaged across clients and gross of fees, two of five strategies outperformed during the quarter, and three of five have outperformed since inception.
Volatility has returned over the past few weeks. On Friday February 2nd, the S&P 500 Index fell 2.1%. Then on the following Monday, February 5th, the S&P 500 Index dropped 4.1%, one of the 100 worst days for the market index since 1936 and the worst since 2011. The VIX (a measure of stock market volatility) more than doubled from 17% to 37%. Highly volatile but non-directional trading has prevailed in the week since then. As of the close on Tuesday February 13th, the market is down 7.2% from its peak in January.
This quick plunge may seem cataclysmic after the otherworldly calm of the past several years. Yet, far from being cataclysmic, occasional market declines of this magnitude are to be expected. Before last Monday’s decline, it had been 588 days since the S&P 500 was more than 5% below its all-time high -- the longest such streak in market history. Realized volatility for 2017 was a mere 6.7% -- only 1964 was lower. The S&P is basically flat for 2018, and is up ~17% over the past year. The market is still doing remarkably well, and the lack of volatility over the past few years has been the rare exception rather than the historical norm.
Further, we think there is a possibility of much more substantial declines to follow. In our quarterly letters, we’ve been warning about stretched US equity valuations since inception. During 4Q16, we pointed out that valuations were higher than all previous valuation peaks excepting the tech bubble. In 1Q17, we noted that “sudden and precipitous falls erasing months or years of market gains are common when periods of high valuation are accompanied by deteriorating market action.” In 2Q17, we observed that valuations are even higher than they appear because of embedded record corporate profit margins, and worried that the unprecedented shift into passive investing and out of active value investing might exacerbate future downturns.
Yet the market has continued to climb. This has not assuaged our concerns, but rather made them more acute. Valuations are even higher, and substantial risks and warnings signs abound.
-
End of easy money era. Central banks in aggregate are expected to switch from quantitative easing to quantitative tightening. The unprecedented era of easy money since the financial crisis has supported stock prices by causing investors to reach for return in risky assets like stocks. If interest rates rise and the return on low-risk assets increases to something more palatable, investors may leave equities for calmer shores.
-
Return of inflation. The output gap caused by the Great Recession has nearly disappeared; as capacity constraints become binding, inflation may return. Periods of rising inflation are some of the worst for equities.
-
Profit margin reversion. Valuations are even richer than they appear at first glance since recent earnings have been inflated by record high profit margins. Some of this may be a secular rise in profit margins, but there are most likely some cyclical elements as well. For example, labor compensation as a percentage of GDP has been depressed due to the weak job market since the financial crisis. As we reach full employment, expect labor’s share to increase, and profits to decline commensurately. Also, the savings rate as a percentage of disposable income is extremely low; consumers cannot keep up the current pace of spending for long.
-
Record bullish sentiment. Extreme bullish sentiment often presages market tops, as it means investors are overly complacent, and that there is no one else left to buy stocks. In January, the Investor’s Intelligence survey contained the highest percentage of bulls since 1986. Other surveys found similarly extreme sentiment.
-
Dearth of prospective buyers. Active value managers, the traditional buyers of equities during market drawdowns, are greatly diminished in size. Value managers have lost significant assets because of the flood to passive, as well as the unprecedented underperformance of value investing over the past decade. Not only are these active value investors fewer and farther between than in previous eras, they would likely only be interested in increasing exposure to stocks at historically attractive valuations, which are substantially lower than the near-record valuations prevailing today.
-
Geopolitical risks. Geopolitical tensions around the world are high, best quantified by the Geopolitical Risk Index developed by the Federal Reserve Board, which has been drifting upwards for the last several years. Unsurprisingly, threats of adverse geopolitical events are associated with a decline in real activity and lower stock returns.
-
Debt risks. Debt risks are high. Easy money has fueled record global debt issuance. High-yield bond spreads have been compressed to 2007 levels. US debt issuance, at $1trn in 2017, is forecasted to rise to $2trn in 2019.
We’re in an equity goldilocks zone. A deteriorating economy likely causes market declines (via falling earnings and bankruptcies). Yet counterintuitively, an economy that does better may cause market declines as well (via rising inflation and interest rates that lead to lower valuations).
In a best-case scenario for the stock market, the economy continues chugging along at a moderate pace, no geopolitical or debt risks surface, profit margins continue at their record pace, and thus both earnings and valuations stay elevated. But even in this best-case scenario, we anticipate only low single-digit nominal returns and negligible real returns for US equities. We do not think this is adequate compensation for the risks involved.
Bireme clients who utilize our full investment suite are cushioned from US equity drawdowns in three ways. First, we continue to substantially underweight US equities. Second, FV is less than 90% invested, and has been since inception. (Despite this handicap, FV has outperformed the S&P 500 by 18.9% gross.) This cash cushion minimizes the impact of market drawdowns, and leaves us with dry powder to put to work in times of greater opportunity. Third, our market-neutral strategies can enjoy positive returns regardless of the direction of financial markets.
Fundamental Value
Fundamental Value had an exceptional quarter, up 10.7% vs the S&P 500 which was up 6.8%. For the year, FV finished with a 28.2% gross return vs the S&P’s 21.7%. The positive relative results were notable given the cash balance mentioned above and the fact that traditional value indices underperformed in 2017, a headwind for our strategy which tends to favor such stocks.
Despite the market’s increasingly rich valuation, we continue to find stocks we believe will generate high single-digit to low double-digit returns. This leaves us optimistic for the returns of FV going forward, despite our expectation of less than five percent returns for the US stock market as a whole.
During the quarter, we made two significant trades, taking one new position and exiting one position.
The lone position we initiated was a company called HCA Healthcare, one of the largest hospital operators in the country. In 2017, this for-profit operator’s 177 acute care hospitals and 250+ outpatient facilities generated over $43 billion in revenue and adjusted earnings per share of about $6.70. This means the stock, which we began purchasing around $86, is quite cheap at <13 times trailing earnings.
Yet HCA is a great business. On a profitability and returns basis it stands apart from the its peers, with ~19% EBITDA margins and 16% returns on capital. As a reference point, S&P 500 companies average a ~7% return on capital. HCA does not hurt for growth, either, having doubled revenue and profits since coming public in 2009. It has generated this growth both through acquisitions and building new facilities, and emerged with top two market share in nearly all of its core markets. This makes HCA hospitals and outpatient facilities indispensable to insurance companies in those locales. With increased negotiating leverage comes higher reimbursement rates and larger profits for HCA hospitals relative to their for-profit or non-profit peers.
In the end, HCA’s smaller competitors risk getting caught in a cycle of lower reimbursement rates, less money to reinvest, lower quality care, and less relevance to insurers. Many of them have attempted to battle HCA’s scale through mergers, but this has just saddled them with debt. Some are now trying to deleverage by selling assets. This benefits HCA, which has become the natural industry consolidator due to their immense financial resources and ability to tuck acquisitions into their existing networks. Tenet Healthcare’s former CEO said it best when he explained why they sold their Houston hospitals to HCA:
"So we had four hospitals in Houston. They were just so far apart that they weren't exactly a network but they sit beautifully within HCA's network. So this is an example where there was a great acquisition for HCA and it was a great sale for us. And they have tremendous synergies in folding that into their system.”
Despite HCA’s unique advantages, the market seems to unfairly paint all for-profit hospitals with the same brush, valuing them at 10-11x EBIT and 12-13x PE. This is much cheaper than the overall market and probably justified for the lower-quality operators. But we think this creates an opportunity to invest in HCA at a large discount to intrinsic value. HCA is a top five position in Fundamental Value as of this writing.
We also sold out of Biglari Holdings (BH) in the fourth quarter.
Originally called Steak ‘n Shake, Biglari Holdings was solely a restaurant company from its founding in the 1930s until Sardar Biglari got involved in 2007. Biglari, a hedge fund manager at the time, waited a year before launching a proxy challenge that
resulted in his taking over the company. He then abruptly stopped opening new restaurants, preferring instead to invest the cash flow outside the core business.
He has had success with these investments, the largest of which is BH’s 20% stake in Cracker Barrel. These shares were purchased mostly in 2011, and have grown in value as CBRL’s stock price has risen from $50 to $175.
Yet despite these successes, BH stock always traded at a large discount to its apparent value. Most market participants said this was due to the eccentricities and maneuverings of Biglari, who exhibited a blinding ego, sharp mind, and willingness to ignore smaller shareholders. In the end, fears of Biglari were well founded. He managed to secure a lavish pay package, change the company name to his own, and, most egregious of all, vote firm-owned Treasury shares in his own favor to
fend off a proxy challenger in 2015.
Despite our concerns, we always thought the discount implied by the market and Biglari’s undeniably strong investing track record were more than enough to compensate for his shenanigans. What finally changed our mind was the deterioration of the Steak ‘n Shake business, which saw comparable traffic down 4.5% for the first 9 months of 2017 and a decline in profits from $30m to a mere $1m before taxes. With the core restaurant business in a tailspin, we decided the discount was both smaller and more appropriate than we had previously assumed. We sold the shares at around $340 per share, generating a loss of about 15% on our investment.
This was an example of our sell discipline, which emphasizes rational analysis of our investments which have declined in value. It is not easy admitting you are wrong, and research shows that this creates a bias amongst investors called the
disposition effect. This analytical flaw causes an irrational desire to hold on to losers in the hopes of eventually booking a gain. We work hard not to fall prey to this bias, and re-examine our thesis any time a company’s share price declines materially. If nothing has changed, we may increase the size of our position, as we did for 21st Century Fox and Express Scripts in the third quarter. But sometimes we conclude that our thesis was wrong. In those cases we sell, as we did with Biglari Holdings.
Below you'll see a chart of the performance of your investments (in red) compared to a relevant benchmark (in gray). Benchmarks are investable assets chosen because they are most comparable to a given strategy. Since we charge fees at the account level, account returns are shown net of fees, while individual strategy returns are shown gross of fees.
We are grateful for your business and your trust, and a special thank you to those who have referred friends and family. There is no greater compliment.
- Bireme Capital


